Monitoring training progress through visualized metrics is essential for understanding model behavior and tuning hyperparameters effectively.
Supported Visualization Tools
SwanLab ⭐
Modern experiment tracking platform designed for AI research. Recommended.
WandB
Weights & Biases experiment tracking platform.
Console
Simple text-based logging to standard output.
Quick Start with SwanLab
Step 1: Configure SwanLab
Simply set the logger backend to swanlab in your YAML configuration:
Step 2: Start Training
Launch your training as usual:
Step 3: View Training Curves
Automatic Tracking
Once training starts, SwanLab will automatically:
- Track key metrics (reward, success rate, loss, etc.)
- Generate real-time training curves
- Provide a web dashboard for visualization
You can access the SwanLab dashboard through the URL printed in the training logs.
Understanding Training Curves
Key Metrics to Monitor
| Metric | Description |
|---|---|
| Reward | Average reward per episode, indicating task performance |
| Success Rate | Percentage of successfully completed tasks |
| Loss | Training loss from the policy optimization algorithm |
| Response Length | Average length of model responses |
| KL Divergence | Divergence between current and reference policy |
Interpreting the Curves
Example Training Curve:
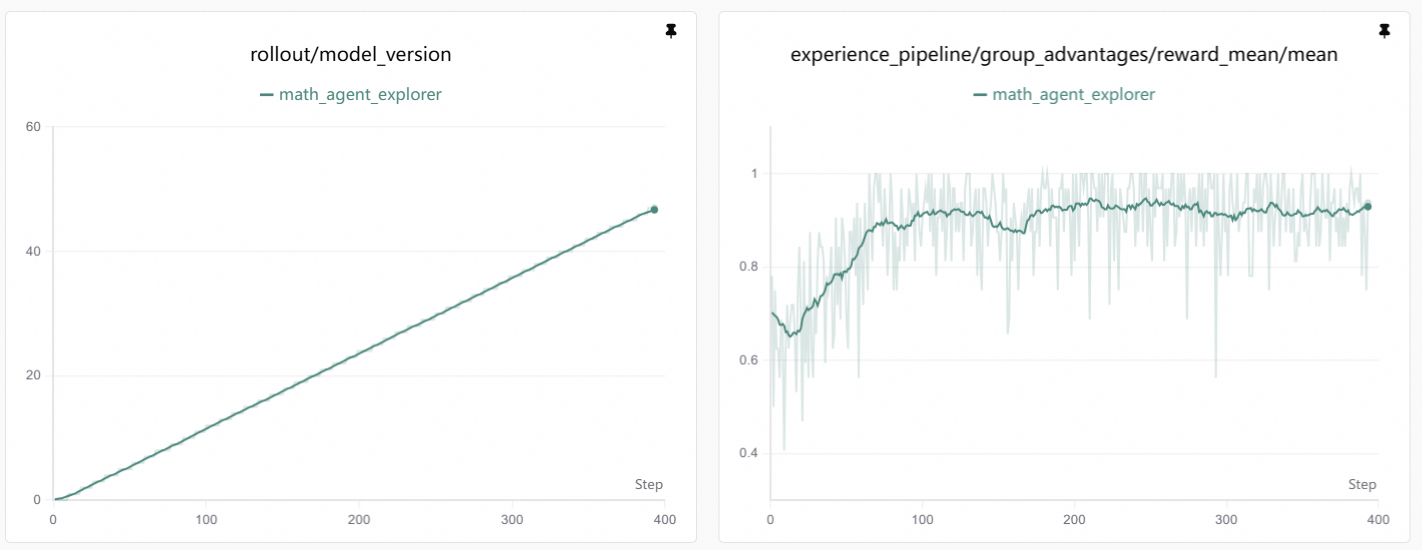
A typical reward curve shows:
| Phase | Description |
|---|---|
| Initial | Reward may be low or unstable as the model explores |
| Learning | Reward gradually increases as the model learns better strategies |
| Convergence | Reward plateaus when the model reaches optimal performance |
What to Look For
- Rising trend: Indicates successful learning
- Plateaus: May indicate convergence or need for hyperparameter adjustment
- Sudden drops: Could signal instability or overfitting
Best Practices
Monitor Multiple Runs
Compare different hyperparameter settings by running multiple experiments and comparing their curves side-by-side.
Set Appropriate Logging Frequency
Balance between logging detail and training overhead:
Save Checkpoints at Key Points
Configure checkpoint saving to preserve models at peak performance: